On April 4, 2020, the NCTA COVID-19 Dashboard went live for the first time. In order to keep the public informed about network performance during an especially tenuous time, NCTA began collecting and aggregating anonymized data from nine of the leading internet service providers in the U.S. dating back to March 1—prior to when states started issuing lockdowns. As 2020 begins to draw to a close, it’s worth taking a look back at some of the insights that the dashboard has provided on how broadband networks handled sudden surges in internet traffic. The NCTA paper, ‘Tele-Everything and Its Impact to the Network,’ which was prepared for the Cable-Tec Expo 2020 Technical Forum, takes a look at these traffic patterns, as well as traffic growth, throughout key points in the pandemic when millions of Americans hunkered down at home and turned to the internet to continue a semblance of their lives online.
First, it’s important to take into account that the overall capacity of cable networks are fluid, as cable operators add capacity each week. It’s also important to note that the dashboard reports on two metrics in order to provide the best insight into the performance of broadband networks: 1) change in peak utilization for the upstream and the downstream, and 2) service group utilization grouped by state to get better granularity at the state level. This means that the dashboard reports on changes in data from before state shutdown orders were issued and going forward, in order to provide a clear picture of how performance changed from before March.
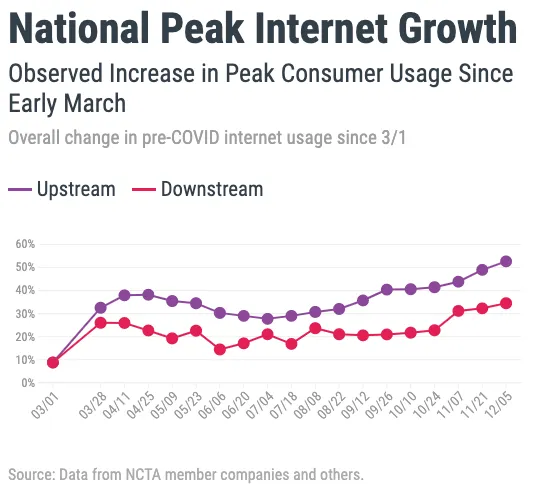
Overall, broadband usage increased significantly due to shutdowns. Specifically, for downstream traffic, the largest change that the paper covered occurred in late March, when downstream traffic reached 20% peak utilization. Meanwhile, upstream traffic experienced its largest change at 35% in mid-April.
Other reports also showed overall traffic growth between 20-50% during this time period. As the paper indicates, “the shift to tele-everything resulted in cable networks experiencing about six months to a years’ worth of traffic growth in a month … ” Notably, the paper found that this growth did not have any measurable impact on download or upload speeds.
An issue that the paper also looked into was the potential impact on upstream traffic that would result from higher usages of video conferencing for work, school, and entertainment. Video conferencing applications experienced as much as a 700% growth on select networks. However, the paper points out that even though video conferencing grew much more than the usage of video streaming, video streaming still uses an average of 5x more bandwidth than video conferencing. And, downstream traffic also grew 9x as much as the upstream did in average bandwidth. The paper also observes how the content delivery networks of popular video streaming services held up with the sudden growth in traffic, and shows that there was no measurable impact found on a user’s quality of experience.
With a global health crisis speeding up the rate at which people turn to the internet, whether that be for telehealth, remote work, entertainment, or distance learning purposes, this year has proven that America’s broadband networks are more than adequately capable of handling drastic increases in internet usage. Over the past 20 years, cable operators have invested over $290 billion in infrastructure and technology, smart and responsive engineering, and a flexible network foundation that is constantly being monitored and upgraded. The result is a high-quality internet experience that millions of people can count on, no matter what else is going on in the world. And while it’s still unclear what 2021 may bring, one thing is certain: Cable ISPs are prepared for anything.
To read the full report, click here.